Exploring Application Insights for disconnected or connected deep telemetry in ASP.NET Apps
Today on the ASP.NET Community Standup we learned about how you can use Application Insights in a disconnected scenario to get some cool - ahem - insights into your application.
Typically when someone sees Application Insights in the File | New Project dialog they assume it's a feature that only works in Azure, that will create some account for you and send your data to the cloud. While App Insights totally does do a lot of cool stuff when you have a cloud-hosted app and it does add a lot of value, it also supports a very useful "SDK only" mode that's totally offline.
Click "Add Application Insights to project" and then under "Send telemetry to" you click "Install SDK only" and no data gets sent to the cloud.
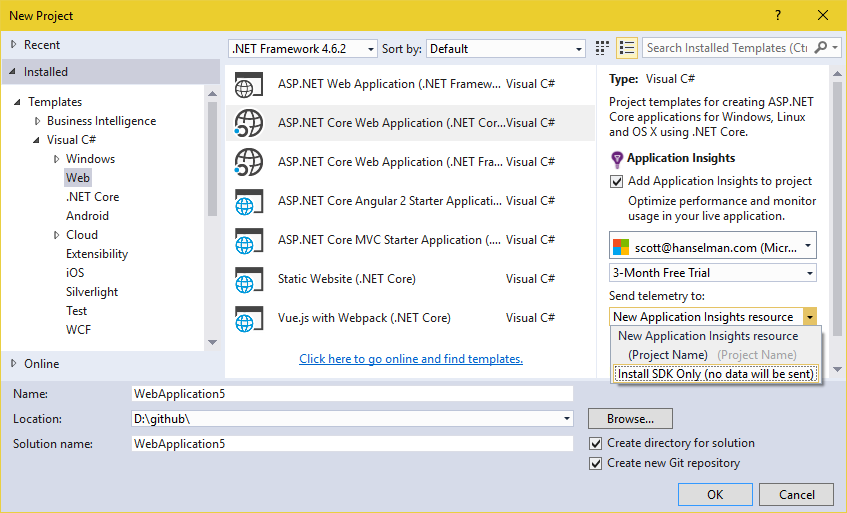
Once you make your new project, can you learn more about AppInsights here.
For ASP.NET Core apps, Application Insights will include this package in your project.json - "Microsoft.ApplicationInsights.AspNetCore": "1.0.0" and it'll add itself into your middleware pipeline and register services in your Startup.cs. Remember, nothing is hidden in ASP.NET Core, so you can modify all this to your heart's content.
if (env.IsDevelopment())
{
    // This will push telemetry data through Application Insights pipeline faster, allowing you to view results immediately.
    builder.AddApplicationInsightsSettings(developerMode: true);
}
Request telemetry and Exception telemetry are added separately, as you like.
Make sure you show the Application Insights Toolbar by right-clicking your toolbars and ensuring it's checked.

The button it adds is actually pretty useful.
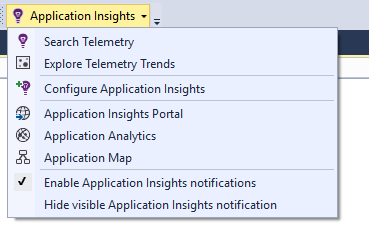
Run your app and click the Application Insights button.
NOTE: I'm using Visual Studio Community. That's the free version of VS you can get at http://visualstudio.com/free. I use it exclusively and I think it's pretty cool that this feature works just great on VS Community.
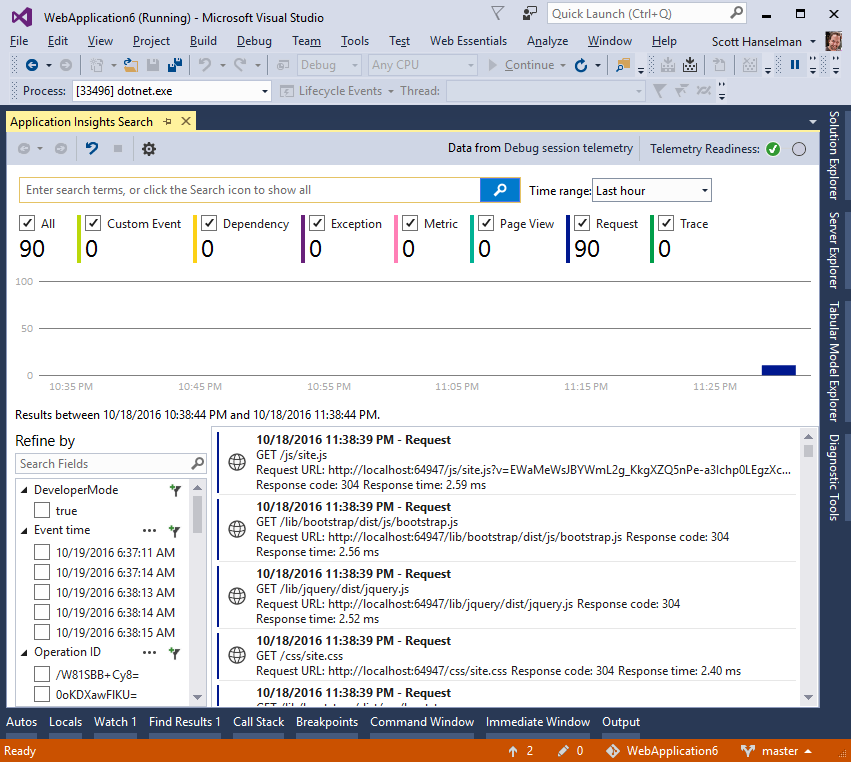
You'll see the Search window open up in VS. You can keep it running while you debug and it'll fill with Requests, Traces, Exceptions, etc.
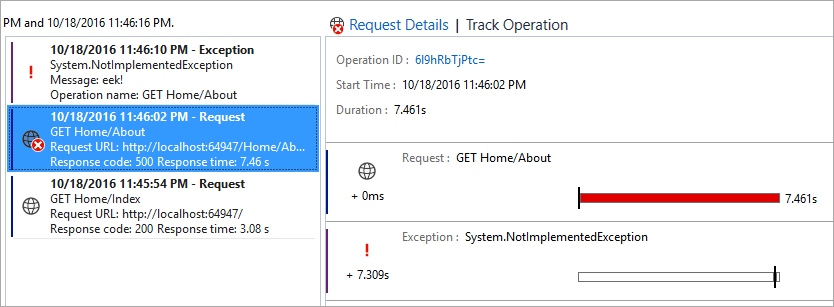
I added a Exceptional case to /about, and here's what I see:
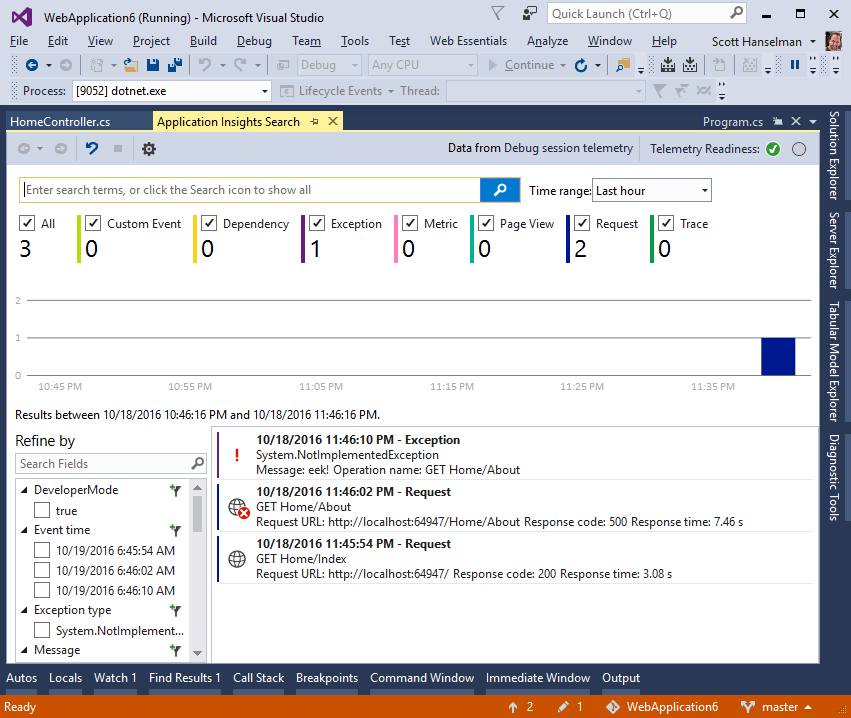
I can dig into each issue, filter, search, and explore deeper:
And once I've found something interesting, I can explore around it with the full details of the HTTP Request. I find the "telemetry 5 minutes before and after" query to be very powerful.
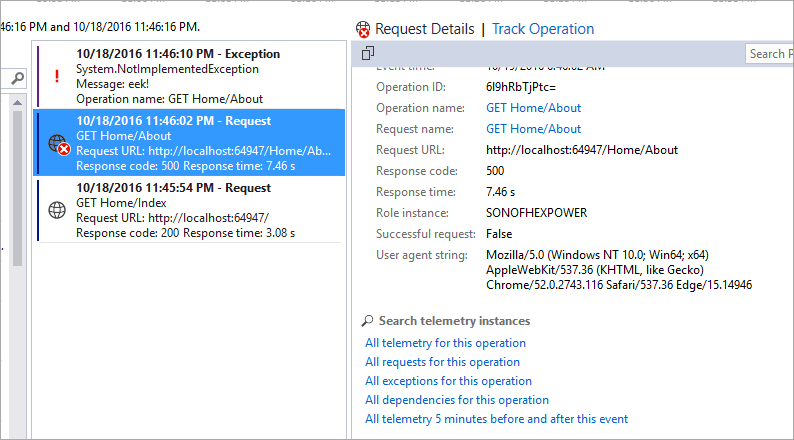
Notice where it says "dependencies for this operation?" That's not dependencies like "Dependency Injection" - that's larger system-wide dependencies like "my app depends on this web service."
You can custom instrument your application with the TrackDependancy API if you like, and that will cause your system's dependency to light up in AppInsights charts and reports. Here's a dumb example as I pretend that putting data in ViewData is a dependency. It should be calling a WebAPI or a Database or something.
var telemetry = new TelemetryClient();

var success = false;
var startTime = DateTime.UtcNow;
var timer = System.Diagnostics.Stopwatch.StartNew();
try
{
    ViewData["Message"] = "Your application description page.";
}
finally
{
    timer.Stop();
    telemetry.TrackDependency("ViewDataAsDependancy", "CallSomeStuff", startTime, timer.Elapsed, success);
}
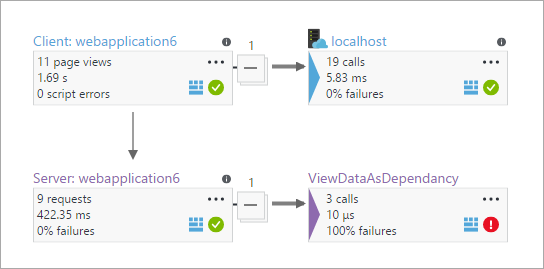
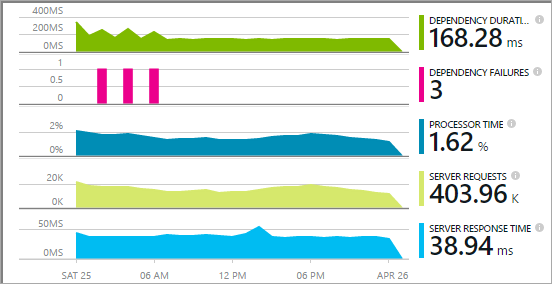
Once I'm Tracking external Dependencies I can search for outliers, long durations, categorize them, and they'll affect the generated charts and graphs if/when you do connect your App Insights to the cloud. Here's what I see, after making this one code change. I could build this kind of stuff into all my external calls AND instrument the JavaScript as well. (note Client and Server in this chart.)
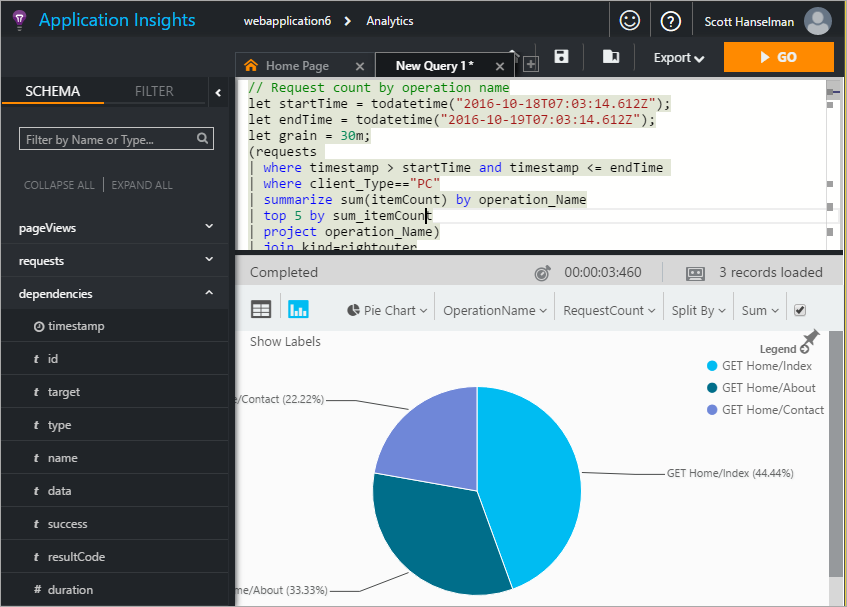
And once it's all there, I can query all the insights like this:
To be clear, though, you don't have to host your app in the cloud. You can just send the telemetry to the cloud for analysis. Your existing on-premises IIS servers can run a "Status Monitor" app for instrumentation.
There's a TON of good data here and it's REALLY easy to get started either:
- Totally offline (no cloud) and just query within Visual Studio
- Somewhat online - Host your app locally and send telemetry to the cloud
- Totally online - Host your app and telemetry in the cloud
All in all, I am pretty impressed. There's SDKs for Java, Node, Docker, and ASP.NET - There's a LOT here. I'm going to dig deeper.
Sponsor: Big thanks to Telerik! 60+ ASP.NET Core controls for every need. The most complete UI toolset for x-platform responsive web and cloud development. Try now 30 days for free!
About Scott
Scott Hanselman is a former professor, former Chief Architect in finance, now speaker, consultant, father, diabetic, and Microsoft employee. He is a failed stand-up comic, a cornrower, and a book author.
About Newsletter
can you learn more about AppInsights here.
Under the first image
I think you mean
you can ........
@Alex Marshall - The offline functionality Scott showed is for using the App Insights tools against telemetry collected while you debug locally in VS. If you configure your app to send data to the App Insights service in Azure, then when you debug, your app will send telemetry to the cloud just like it would in production (whatever instrumentation key is being used by the App Insights SDK during your debug session). Sounds like you're looking for a different kind of offline support. Can you describe your scenario a bit more?
@Unbounded Context - Totally. Check out this doc.
I've found that we miss lot of telemetry in AI server during high load periods. Do you have any articles/tips how diagnose this problem and fix?
Yes it is possible to use App Insights for an existing Web App.
https://azure.microsoft.com/en-us/documentation/articles/app-insights-azure-web-apps/#enable-an-extension
It's the former. I have a web service that my customers install. I want to give them the option at install time (or post-install via configuration) to opt in or out of permitting the application to send analytics off-machine.
@David Gardiner - You can totally make this happen. You'll need to implement the send/don't send logic yourself as part of some telemetry abstraction in your app, based on the user's choice.
@Carlos Ferreira - There are App Insights SDKs for a bunch of different platforms, including .NET Core. If you're using the SDK, the code sending the telemetry to the App Insights service is part of your app itself, so there's no separate "reader".
When deployed, I push everything to the App Insights server, but for development I like everyone to keep their data isolated. No sense in everyone seeing exceptions for in-progress work that may not even get committed.
I'm loading JS AppInsights using the "snippet" technique and have an empty string for instrumentation key in the dev environment, but nothing is showing up in Visual Studio.
@Martin - Glimpse is great for server + client profiling and diagnostics while you're developing locally. The App Insights features in VS that Scott showed fill similar roles, just in VS instead of the browser. The big distinction is having App Insights telemetry for your service in production in addition to while developing, across every instance of your service. You can view this production telemetry in the Azure Portal or VS.
@Jason - The browser-side JavaScript telemetry requires an instrumentation key (and therefore an App Insights resource in Azure), so it's not supported in local-only mode in VS. One way to separate your development and production telemetry is to create separate App Insights resources for each. They usually wind up in separate Azure resource groups, alongside databases and other resources you want to group together by "dev" or "prod." Then you'd need to switch out the instrumentation keys for those resources when you deploy, just like you would database connection strings. To change which resource the Visual Studio features read data from, right-click your project, and choose "Application Insights - Choose Telemetry Source."
@Ajax control toolkit - App Insights works with WebForms apps. If you're using Visual Studio 2015, right-click your project and choose "Add Application Insights Telemetry." Or, install the App Insights Web SDK; then in your Web.config, make sure under system.web there's an httpModule called "ApplicationInsightsWebTracking." Check out the documentation for more details.
Comments are closed.
The scenario I'm thinking of is where I'd like use Insights in a web service that gets installed by customers, but want to have the ability to ask the customer whether they give permission for Insights data to be sent to the cloud or not.
David