dotnet-trace for .NET Core tracing in PerfView, SpeedScope, Chromium Event Trace Profiling, Flame graphs and more!
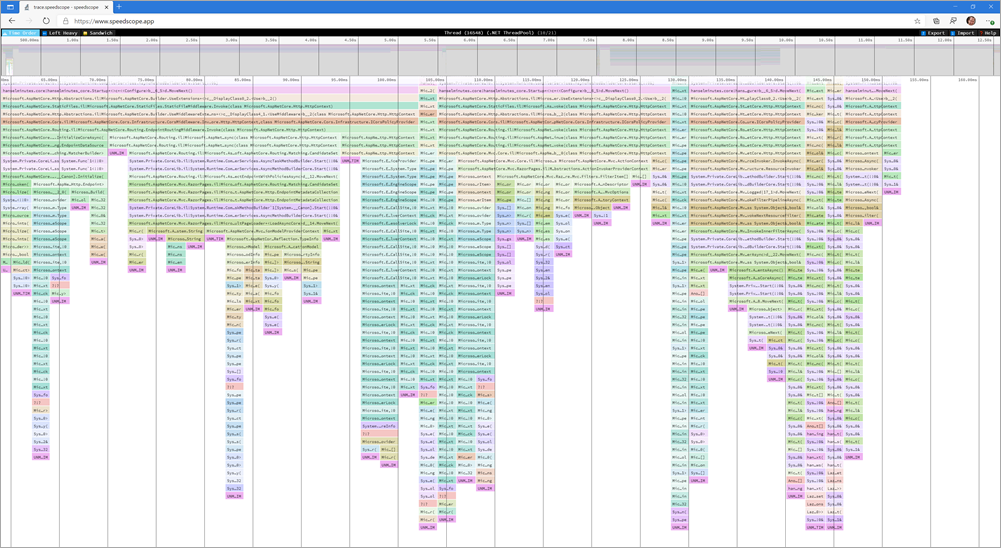
Speedscope.app is an online "flamegraph visualizer" that you can also install offline. It's open source and on GitHub. It will allow you to view flamegraphs that have been generated by diagnostic tools, but Speedscope is good at dealing with large files without issues or crashing. There's lots of choices in viewers of flamegraphs, but this is a good one.
Adam Sitnik has a great blog about how he implemented flamegraphs for .NET.
Speedscope has a simple file format in JSON, and PerfView already exists is free and open source. PerfView is something you should download now and throw in your PATH. You'll need it someday.
We saw in the last blog post that I did a GC Dump of my running podcast site, free command line tools. Now I'll do a live running trace with
dotnet-trace
So I'll just dotnet trace ps and then
dotnet trace collect -p 18996
Which gives me this live running trace until I stop it:
Provider Name                           Keywords            Level               Enabled By
Microsoft-DotNETCore-SampleProfiler     0x0000000000000000  Informational(4)    --profile
Microsoft-Windows-DotNETRuntime         0x00000014C14FCCBD  Informational(4)    --profile

Process        : D:\github\hanselminutes-core\hanselminutes.core\bin\Debug\netcoreapp3.1\hanselminutes.core.exe
Output File    : C:\Users\scott\trace.nettrace

[00:00:00:15]   Recording trace 866.708  (KB)
Stopping the trace. This may take up to minutes depending on the application being traced.

Trace completed.
Even though this ran for just 15 seconds I collected many thousands of traces. If I need to, I can now find out EXACTLY what's happening in even short timeframes OR I can visualize what's happening over longer timeframes.
Ah, but check out this switch for dotnet trace!
--format <Chromium|NetTrace|Speedscope>
That's a useful game changer! Let's try a few, maybe Speedcope and that interestingly named Chromium format. ;)
NOTE: If you have any errors with Speedscope format, make sure to "
dotnet tool update -g dotnet-trace"
Now you'll get a something.speedscope.json that you can open and view in SpeedScope. You'll see a WEALTH of info. Remember that these formats aren't .NET specific. They aren't language specific at all. If you have a stack trace and can sample what's going on then you can make a trace that can be presented as a number of visualizations, most notably a flamegraph. This is 'how computers work' stuff, not '.NET stuff." It's great that these tools can interoperate so nicely.
There is so much info that you'll want to make you own with dotnet trace and explore. Be sure to scroll and CTRL-scroll to zoom around. Also be sure to look at the thread picker at the top center in the black title area of SpeedScope.

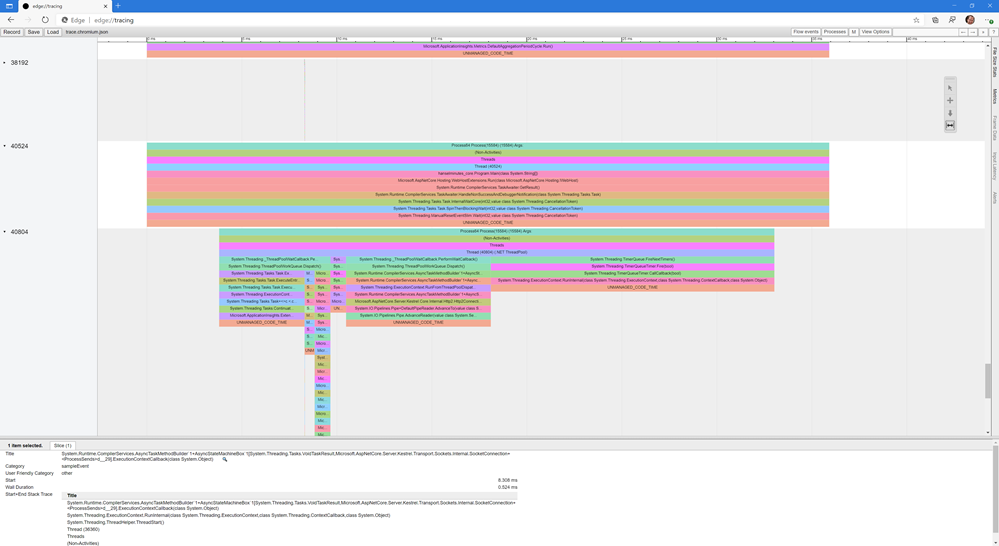
Remember how I pushed that this isn't language specific? Try going to edge://tracing/ in new Edge or in chrome://tracing in Chrome and load up a dotnet trace created with --format Chromium! Now you can use the Trace Event Profiling Tool!
Same data, different perspective! But this time you're using the tracing format that Chromium uses to analyze your .NET Core traces! The dotnet-trace tool is very very powerful.

Be sure to go read about Analysing .NET start-up time with Flamegraphs at Matt Warren's lovely blog.
Sponsor: Have you tried developing in Rider yet? This fast and feature-rich cross-platform IDE improves your code for .NET, ASP.NET, .NET Core, Xamarin, and Unity applications on Windows, Mac, and Linux.
About Scott
Scott Hanselman is a former professor, former Chief Architect in finance, now speaker, consultant, father, diabetic, and Microsoft employee. He is a failed stand-up comic, a cornrower, and a book author.


About Newsletter
and let you know a few of the images aren't loading
correctly. I'm not sure why but I think its
a linking issue. I've tried it in two different web browsers and both show the same results.
He was entirely right. This post actually made my day. You cann't
imagine just how much time I had spent for this info! Thanks!
be able to without difficulty understand it, Thanks a lot.
"Notify me when new comments are added" checkbox
and now each time a comment is added I get three emails with the same comment.
Is there any way you can remove me from that service?
Thank you!
really knows what they're talking about on the internet.
You actually realize how to bring a problem to light and make it important.
A lot more people really need to check this out and understand this side of your story.
It's surprising you're not more popular since you definitely possess the gift.
online same day
Comments are closed.
