Scott Hanselman

How to use, open, resize, and split Panes in the Windows Terminal

September 30, 2020 Comment on this post [4] Posted in Win10
Sponsored By

My love and appreciate for the new open-source Windows Terminal is well-documented. I enjoy customizing the Windows Terminal with a nice prompt.

The Terminal of course has Tabs so you can open many different shells at once within a terminal instance, often I want to do things like Split Screen/Split Pane. "Use Tmux!" you might shout, and that's a valid thing to yell if I was only living in Linux (using WSL2). There are several multi-pane options to choose from within a shell using something like tmux.

However, the Windows Terminal supports a multi-pane view at the Terminal-level, regardless of shell!

There's great docs on setting up hotkeys for this, and you should.

The best way to get started with ZERO setup is to click the main Dropdown in Windows Terminal and hold down the ALT key while you click on a shell!

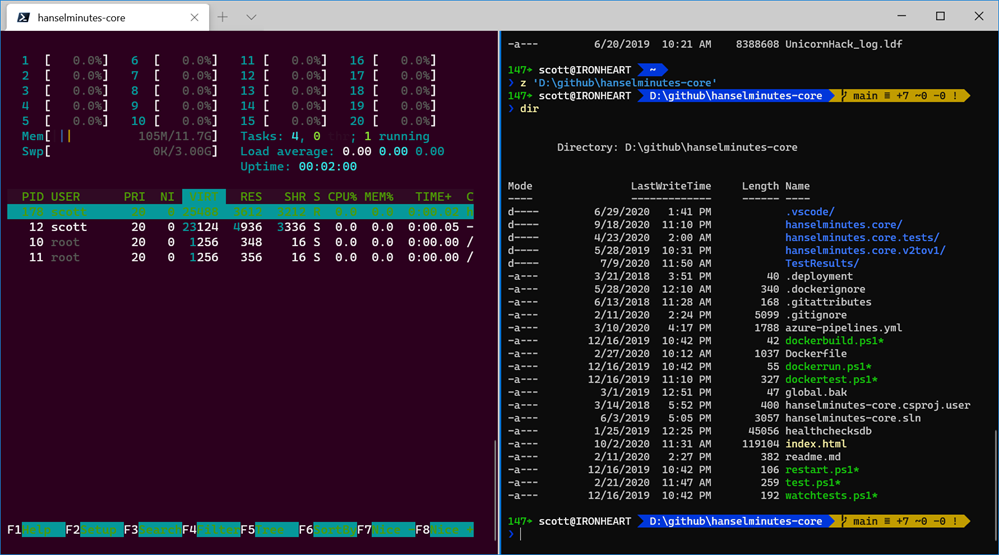
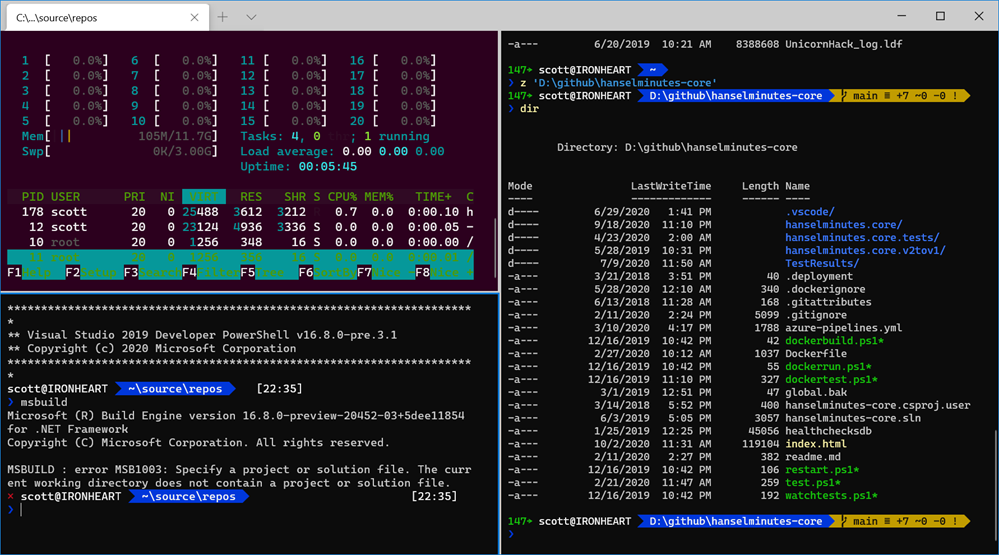
Below you can see Ubuntu/WSL2 on the left running htop, while on the right I'm running PowerShell 7 (powered by .NET Core) and sitting in my podcast's source code directory.

MultiPane Windows Terminal

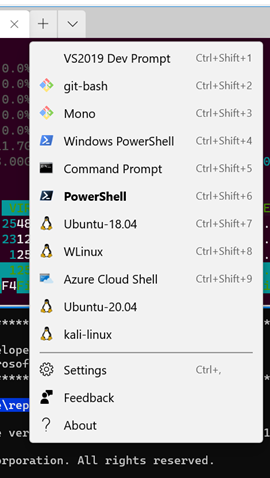
I'll then click the dropdown, hold ALT, and click on the Visual Studio Developer Command Prompt that I've added to the menu. I'm doing this while Ubuntu is the focused pane.

My Windows Terminal Menu

And the result:

Three panes in Windows Terminal

Now you can see the VS2019 prompt in the lower left corner. With hotkeys I can control where panes open.

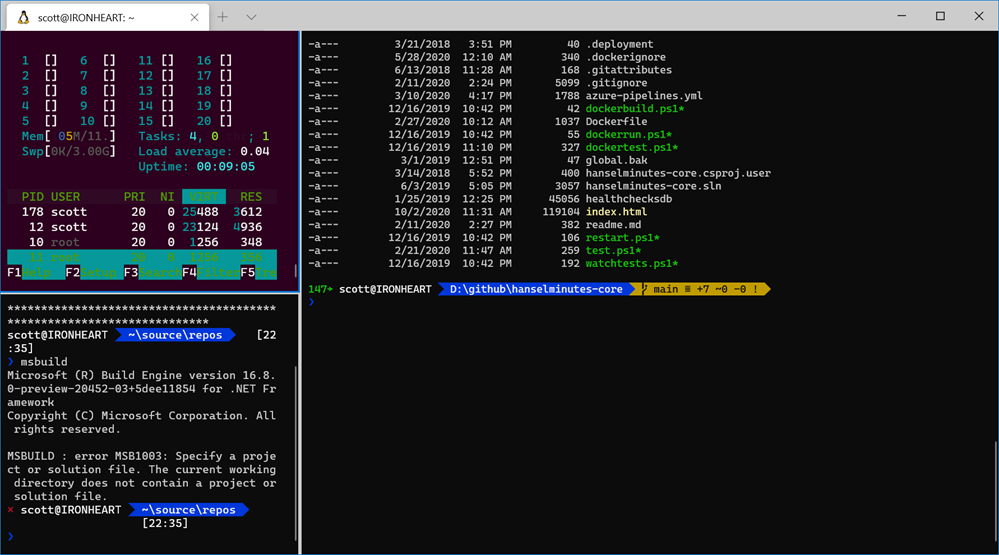
I can even navigate between pans with the ALT key and my arrow keys! Even better, SHIFT+ALT and the arrow keys will resize them!

Resized my Terminal Panes

Go spend some time learning about Panes in Windows Terminal and let me know how it goes for you! It's gonna make your command line life so much better!

ACTION: Finally, please take a moment and subscribe to my YouTube or head over to http://computerstufftheydidntteachyou.com and explore! I'd love to hit 100k subs over there. I heard they give snacks.


Sponsor: Suffering from a lack of clarity around software bugs? Give your customers the experience they deserve and expect with error monitoring from Raygun.com. Installs in minutes, try it today!

About Scott

Scott Hanselman is a former professor, former Chief Architect in finance, now speaker, consultant, father, diabetic, and Microsoft employee. He is a failed stand-up comic, a cornrower, and a book author.

facebook bluesky subscribe
About   Newsletter
Hosting By
Hosted on Linux using .NET in an Azure App Service

Exploring your .NET applications with dotnet-monitor

September 25, 2020 Comment on this post [6] Posted in
Sponsored By

I talked about Cross-platform diagnostic tools for .NET Core and dotnet-trace for .NET Core tracing but I would be remiss if I didn't show and mention "dotnet monitor."

dotnet monitor is an experimental tool that makes it easier to get access to diagnostics information in a dotnet process. If you're running .NET Core within a container - or mostly likely in Kubernetes - this tool offers an insight into your running microservice. Basically it creates a microservice of its own that you can interrogate to better understand what's happening.

HELP! Confused about Kubernetes? Check out http://computerstufftheydidntteachyou.com and my most recent video on Kubernetes and Container Orchestration.

Assuming you have .NET Core installed, you can install dotnet monitor as a global tool:

dotnet tool install -g dotnet-monitor --add-source https://dnceng.pkgs.visualstudio.com/public/_packaging/dotnet5-transport/nuget/v3/index.json --version 5.0.0-preview.*

You then just run it along side your project or running process.

dotnet monitor collect

The developer blog on dotnet monitor shows you how you can share a volume mount between your application container and a container running dotnet monitor if you like. If you're in k8s (Kubernetes) you should run dotnet monitor as a sidecar to your container within the same pod.

It'll start up and you can talk to dotnet monitor with curl, wget, and pipe through jq and hit localhost:52323/processes to get a list of .NET Core processes it can think about.

NOTE: If you are running this locally and get auto redirected to HTTPS then you may have a cached HSTS policy for localhost from other work. Head over to edge://net-internals/#hsts (or chrome://) and scroll to the bottom and delete the Domain Security Policies for localhost.

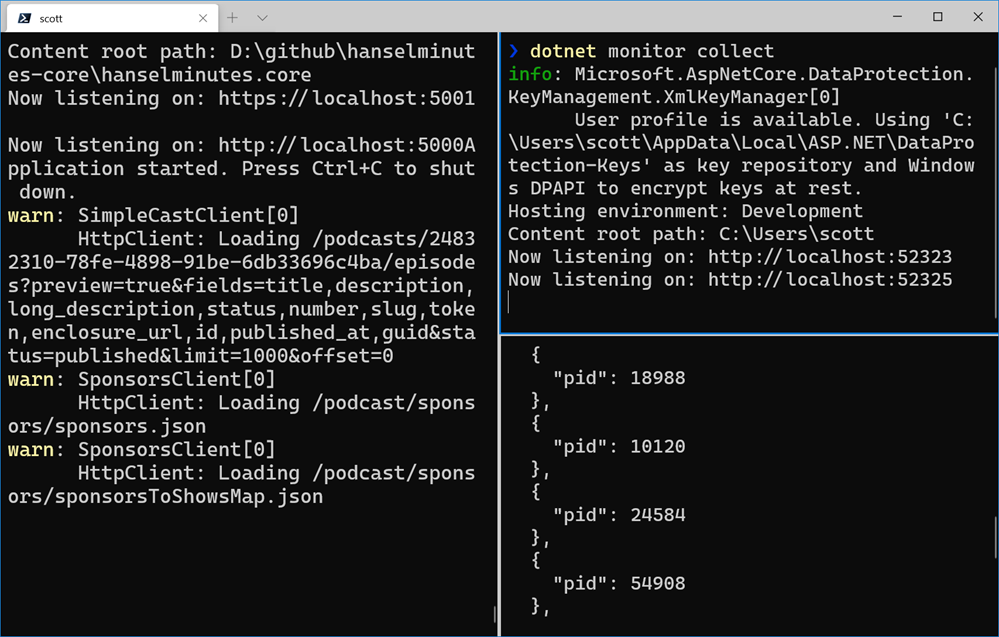
Now I can curl and see the output. I have my podcast on the left pane in Windows Terminal, dotnet monitor collect in the upper right, and the output lower right.

dotnet monitor

Once I figure out my process id (PID) - which will be automatic within a container as there will only be one - I can explore any of these local endpoints:

  • /processes
  • /dump/{pid?}
  • /gcdump/{pid?}
  • /trace/{pid?}
  • /logs/{pid?}
  • /metrics

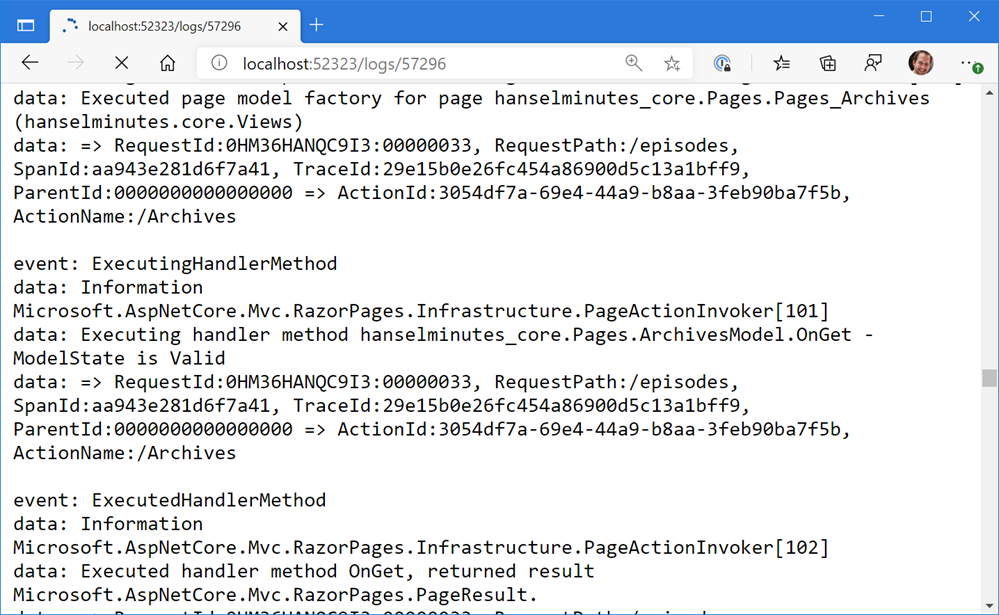
If you are getting the logs, you'll get a never ending text/event-stream in your browser. I'd recommend you "curl" to see this at the command line.

text/eventstream in your browser

You can also get momentary traces, collect a nettrace file and analyze it in Visual Studio, PerfView or other tools.

The dotnet monitor is experimental, but if you're digging it, head over to the dotnet/diagnostics GitHub and show some support.

SOS and Other Diagnostic Tools

  • SOS - About the SOS debugger extension.
  • dotnet-dump - Dump collection and analysis utility.
  • dotnet-gcdump - Heap analysis tool that collects gcdumps of live .NET processes.
  • dotnet-trace - Enable the collection of events for a running .NET Core Application to a local trace file.
  • dotnet-counters - Monitor performance counters of a .NET Core application in real time.

Hope this helps you!


Sponsor: Upgrade from file systems and SQLite to Actian Zen Edge Data Management. Higher Performance, Scalable, Secure, Embeddable in most any programming language, OS, on 64-bit ARM/Intel Platform.

About Scott

Scott Hanselman is a former professor, former Chief Architect in finance, now speaker, consultant, father, diabetic, and Microsoft employee. He is a failed stand-up comic, a cornrower, and a book author.

facebook bluesky subscribe
About   Newsletter
Hosting By
Hosted on Linux using .NET in an Azure App Service

Blazor WebAssembly on Azure Static Web Apps

September 23, 2020 Comment on this post [17] Posted in ASP.NET | DotNetCore
Sponsored By

Blazing Pizza Blazor AppMany apps today are just static files on the front end - HTML and JavaScript - with something powerful on the server side. They aren't "static apps" as they have very dynamic front end experiences, but they are static in that their HTML isn't dynamically generated.

As such, you don't need to spend the money on an Azure Web App when an Azure Static Web App will do! These apps get free SSL certs, custom domains, web hosting for static content, and fit into a natural git-based workflow for publishing. You can build modern web applications with JavaScript frameworks and libraries like Angular, React, Svelte, Vue, or using Blazor to create WebAssembly applications, with an Azure Functions back-end or publish static sites with frameworks like Gatsby, Hugo, VuePress.

But there's big news out of Ignite this week, with Azure Static Web Apps now supporting Blazor applications. You can develop and deploy a frontend and a serverless API written entirely in .NET.

To get started "hello world style" there is a GitHub repository template that's a starting point. It's a basic web app with a client that uses Blazor and .NET that is run on the client-side in your browser using WebAssembly.

Called it! It's almost a decade later and yes, JavaScript (and WebAssembly) is the assembly language for the web!

So the client runs in the browser written in C#, the server runs as a serverless Azure Function (meaning no identifiable VM, and it just scales as needed) also written in C#, and this client and server share a data model between Blazor and Functions also written in...wait for it...C#.

An app like this can basically scale forever, cheaply. It can put the browser to work (which was basically hanging out waiting for anglebrackets anyway) and when it needs data, it can call back to Functions, or even Azure CosmosDB.

Be sure to check out this complete Tutorial: Building a static web app with Blazor in Azure Static Web Apps! All you need is a GitHub account and any free Azure Account.

If you want more guided learning, check out the 12 unit module on Microsoft Learn. It shouldn't take more than an hour and you'll learn how to Publish a Blazor WebAssembly app and .NET API with Azure Static Web Apps.

Resources

Also be sure to check out the Day 2 Microsoft Ignite Keynote by yours truly! The app I made and demo in the keynote? Made with Blazor and Azure Static Web Apps, natch! The keynote is happening in three time zones so you can see it at a time that works for you...or on-demand!


Sponsor: Upgrade from file systems and SQLite to Actian Zen Edge Data Management. Higher Performance, Scalable, Secure, Embeddable in most any programming language, OS, on 64-bit ARM/Intel Platform.

About Scott

Scott Hanselman is a former professor, former Chief Architect in finance, now speaker, consultant, father, diabetic, and Microsoft employee. He is a failed stand-up comic, a cornrower, and a book author.

facebook bluesky subscribe
About   Newsletter
Hosting By
Hosted on Linux using .NET in an Azure App Service

dotnet-trace for .NET Core tracing in PerfView, SpeedScope, Chromium Event Trace Profiling, Flame graphs and more!

September 18, 2020 Comment on this post [13] Posted in DotNetCore | Open Source
Sponsored By

Speedscope.app is an online "flamegraph visualizer" that you can also install offline. It's open source and on GitHub. It will allow you to view flamegraphs that have been generated by diagnostic tools, but Speedscope is good at dealing with large files without issues or crashing. There's lots of choices in viewers of flamegraphs, but this is a good one.

Adam Sitnik has a great blog about how he implemented flamegraphs for .NET.

Speedscope has a simple file format in JSON, and PerfView already exists is free and open source. PerfView is something you should download now and throw in your PATH. You'll need it someday.

We saw in the last blog post that I did a GC Dump of my running podcast site, free command line tools. Now I'll do a live running trace with

dotnet-trace

So I'll just dotnet trace ps and then

dotnet trace collect -p 18996

Which gives me this live running trace until I stop it:

Provider Name                           Keywords            Level               Enabled By
Microsoft-DotNETCore-SampleProfiler 0x0000000000000000 Informational(4) --profile
Microsoft-Windows-DotNETRuntime 0x00000014C14FCCBD Informational(4) --profile

Process : D:\github\hanselminutes-core\hanselminutes.core\bin\Debug\netcoreapp3.1\hanselminutes.core.exe
Output File : C:\Users\scott\trace.nettrace

[00:00:00:15] Recording trace 866.708 (KB)
Stopping the trace. This may take up to minutes depending on the application being traced.

Trace completed.

Even though this ran for just 15 seconds I collected many thousands of traces. If I need to, I can now find out EXACTLY what's happening in even short timeframes OR I can visualize what's happening over longer timeframes.

Ah, but check out this switch for dotnet trace!

 --format <Chromium|NetTrace|Speedscope>

That's a useful game changer! Let's try a few, maybe Speedcope and that interestingly named Chromium format. ;)

NOTE: If you have any errors with Speedscope format, make sure to "dotnet tool update -g dotnet-trace"

Now you'll get a something.speedscope.json that you can open and view in SpeedScope. You'll see a WEALTH of info. Remember that these formats aren't .NET specific. They aren't language specific at all. If you have a stack trace and can sample what's going on then you can make a trace that can be presented as a number of visualizations, most notably a flamegraph. This is 'how computers work' stuff, not '.NET stuff." It's great that these tools can interoperate so nicely.

There is so much info that you'll want to make you own with dotnet trace and explore. Be sure to scroll and CTRL-scroll to zoom around. Also be sure to look at the thread picker at the top center in the black title area of SpeedScope.

Speedscope.app

Remember how I pushed that this isn't language specific? Try going to edge://tracing/ in new Edge or in chrome://tracing in Chrome and load up a dotnet trace created with --format Chromium! Now you can use the Trace Event Profiling Tool!

Same data, different perspective! But this time you're using the tracing format that Chromium uses to analyze your .NET Core traces! The dotnet-trace tool is very very powerful.

image

Be sure to go read about Analysing .NET start-up time with Flamegraphs at Matt Warren's lovely blog.


Sponsor: Have you tried developing in Rider yet? This fast and feature-rich cross-platform IDE improves your code for .NET, ASP.NET, .NET Core, Xamarin, and Unity applications on Windows, Mac, and Linux.

About Scott

Scott Hanselman is a former professor, former Chief Architect in finance, now speaker, consultant, father, diabetic, and Microsoft employee. He is a failed stand-up comic, a cornrower, and a book author.

facebook bluesky subscribe
About   Newsletter
Hosting By
Hosted on Linux using .NET in an Azure App Service

Cross-platform diagnostic tools for .NET Core

September 16, 2020 Comment on this post [9] Posted in DotNetCore
Sponsored By

.NET Core is cross-platform and open-source. Tell someone, maybe your boss.

A good reminder. It's been this way for a half decade but I'm still bumping into folks who have never heard this. Moving forward, .NET 5 will be a unification of the .NET Framework you may have heard for years, and the new .NET Core I like talking about, PLUS great goodness, tools and libraries from Mono and Xamarin. It's one cross-platform .NET with a number greater than 4. Because 5 > 4, natch.

NOTE: If you like, you can learn all about What is .NET? over on my YouTube.

Now you've made some software, maybe for Windows, maybe Mac, maybe Linux. There's a lot of ways to diagnose your apps in .NET Core, from the Docs:

  • Logging and tracing are related techniques. They refer to instrumenting code to create log files. The files record the details of what a program does. These details can be used to diagnose the most complex problems. When combined with time stamps, these techniques are also valuable in performance investigations.
  • Unit testing is a key component of continuous integration and deployment of high-quality software. Unit tests are designed to give you an early warning when you break something.
  • Debug Linux dumps explains how to collect and analyze dumps on Linux.

But I want to talk about the...

.NET Core Diagnostic Global Tools

First, let's start with...

dotnet-counters

dotnet tool install --global dotnet-counters

Now that I've installed it, I can see what .NET Core apps I'm running, like a local version of my Hanselminutes podcast site.

dotnet counters ps
18996 hanselminutes.core D:\github\hanselminutes-core\hanselminutes.core\bin\Debug\netcoreapp3.1\hanselminutes.core.exe
14376 PowerLauncher C:\Program Files\PowerToys\modules\launcher\PowerLauncher.exe
24276 pwsh C:\Program Files\PowerShell\7\pwsh.exe

I also see PowerShell 7 in there that I'm running in Windows Terminal. Pwsh is also written in cross platform .NET Core.

I'll run it again with a process id, in this case that of my podcast site:

dotnet counters monitor --process-id 18996

Here I'll get a nice constantly refreshing taskman/processmonitor of sorts in the form of dotnet-countersperformance counters:

dotnet-monitor

Again this works outside Visual Studio and it works everywhere. You can watch them and react, or collect them to a file.

dotnet-dump

The dotnet-dump tool is a way to collect and analyze Windows and Linux core dumps without a native debugger. Although it's not yet supported on macOS, it works on Windows and Linux.

With a similar syntax, I'll dump the process:

dotnet dump collect -p 18996
Writing full to D:\github\hanselminutes-core\hanselminutes.core\dump_20200918_224648.dmp
Complete

Then I'll start an interactive analysis shell session. You can run SOS (Son of Strike) commands to analyze crashes and the garbage collector (GC), but it isn't a native debugger so things like displaying native stack frames aren't supported.

dotnet dump analyze .\dump_20200918_224648.dmp
Loading core dump: .\dump_20200918_224648.dmp ...
Ready to process analysis commands. Type 'help' to list available commands or 'help [command]' to get detailed help on a command.
Type 'quit' or 'exit' to exit the session.
>

There's tons to explore. Debugging production dumps like this is a lost art.

Exploring in dotnet dump

You can also do live Garbage Collector dumps with

dotnet-gcdump

GCDump is:

"a way to collect GC (Garbage Collector) dumps of live .NET processes. It uses the EventPipe technology, which is a cross-platform alternative to ETW on Windows. GC dumps are created by triggering a GC in the target process, turning on special events, and regenerating the graph of object roots from the event stream. This process allows for GC dumps to be collected while the process is running and with minimal overhead."

Once you have a dump you can analyze it in Visual Studio or PerfView on GitHub.

PerfView

Sometimes you may capture a dump from one machine and analyze it on another. For that you may want to download the right symbols to debug your core dumps or minidumps. For that you'll use

dotnet-symbol

This is great for Linux debugging with lldb.

"Running dotnet-symbol against a dump file will, by default, download all the modules, symbols, and DAC/DBI files needed to debug the dump including the managed assemblies. Because SOS can now download symbols when needed, most Linux core dumps can be analyzed using lldb with only the host (dotnet) and debugging modules."

Interesting in some real tutorials on how to use these tools? Why not learn:

In the next blog post I'll look at dotnet trace and flame graphs!


Sponsor: Have you tried developing in Rider yet? This fast and feature-rich cross-platform IDE improves your code for .NET, ASP.NET, .NET Core, Xamarin, and Unity applications on Windows, Mac, and Linux.

About Scott

Scott Hanselman is a former professor, former Chief Architect in finance, now speaker, consultant, father, diabetic, and Microsoft employee. He is a failed stand-up comic, a cornrower, and a book author.

facebook bluesky subscribe
About   Newsletter
Hosting By
Hosted on Linux using .NET in an Azure App Service

Disclaimer: The opinions expressed herein are my own personal opinions and do not represent my employer's view in any way.