Streaming Diagnostics Trace Logging from the Azure Command Line (plus Glimpse!)
I’ve long said when in doubt, turn on tracing. Sometimes "got here"-debugging is a great tool. I tend to use System.Diagnostics.Trace a lot in my code. Then I'll use ELMAH or Glimpse to get more insight.
Lately though, I've been doing a lot of Azure sites and have been wanting to get at trace data, sometimes at the Azure command line.
I'll do this to deploy (or deploy from Visual Studio):
azure site create mysite --git
git add .
git commit -m "initial deploy"
git push azure master
Then later if I want to restart, start, stop, etc I can certainly
azure site restart mysite
But I was talking to one of the devs a while back and said I really wanted
azure site log tail mysite
And they made it! Check this out. You can try it right now.
Add Tracing to your App
First, make an app that has some tracing. Here's mine. Any ASP.NET app is fine, MVC or Web Forms or Web Pages, doesn't matter. Note the Traces.
public class HomeController : Controller
{
    public ActionResult Index()
    {
        ViewBag.Message = "Modify this template to jump-start your ASP.NET MVC application.";
        System.Diagnostics.Trace.TraceError("ZOMG THIS IS BAD");
        return View();
    }

    public ActionResult About()
    {
        ViewBag.Message = "Your app description page.";
        System.Diagnostics.Trace.TraceInformation("Just chillin.");
        return View();
    }
}
Then, upload it to Azure. I did a Publish directly from VS in this case, just right click, Publish and Import the Publish Profile that you download from the portal. You can publish however you like.
![]()
Local Tracing with Trace.axd
You likely know that you can enable tracing locally with trace.axd in your ASP.NET app (and MVC apps) by adding trace listeners to your web.config:
<system.diagnostics>
  <trace>
    <listeners>
      <add name="WebPageTraceListener"
           type="System.Web.WebPageTraceListener, System.Web, Version=4.0.0.0, Culture=neutral, PublicKeyToken=b03f5f7f11d50a3a"/>
    </listeners>
  </trace>
</system.diagnostics>
So if I visit trace.axd locally, I see my traces:

If you really wanted this remotely you could say so also:
<trace enabled="true" writeToDiagnosticsTrace="true" localOnly="false" mostRecent="true" pageOutput="false" />
Streaming Logs from the Azure Command Line
When my app is in Azure, I can get to the tracing info as well. From the management portal, I can see where the log files are, right?
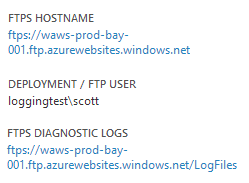
And I can FTP in and see them, as I always could. Notice I am using Explorer to FTP in. I can just copy paste the URL into Explorer itself, then enter my deployment credentials.

I can also do this with my favorite FTP app, or the browser. Inside the Application Folder is where the tracing files are.
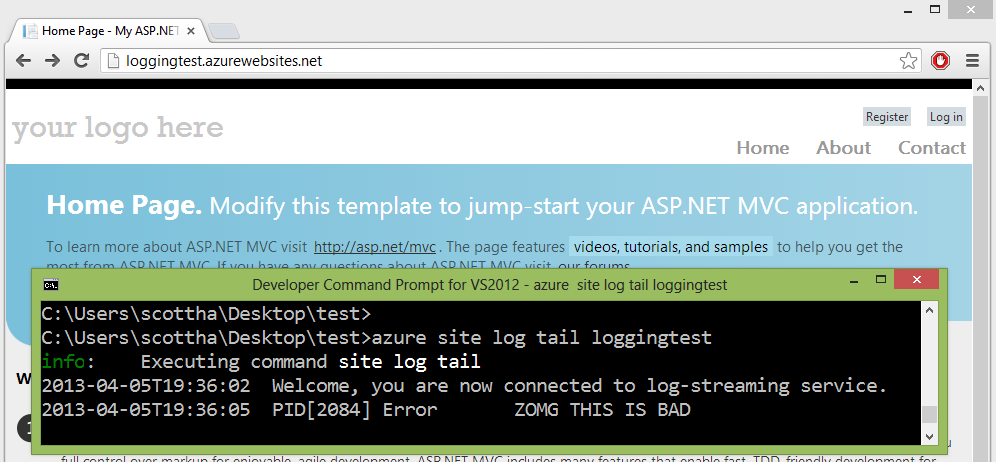
From the command line, I can do this, and the logs are streamed to me.
C:\>azure site log tail mysite
info:    Executing command site log tail
2013-04-05T19:45:10  Welcome, you are now connected to log-streaming service.
2013-04-05T19:45:13  PID[2084] Error       ZOMG THIS IS BAD
This works with both .NET apps and nodejs apps, by the way. All logs written to the LogFiles folder can be streamed in real time. The Application trace logs collected under the LogFiles/Application folder are streamed out by default. you can also get at IIS logs written to the LogFiles/Http folder. Any files created in a custom folder e.g. LogFiles/<Custom> will have their contents streamed as well.
I can also filter for specific characters with --filter, so:
C:\>azure site log tail loggingtest --filter ZOMG
info:    Executing command site log tail
2013-04-05T19:45:10  Welcome, you are now connected to log-streaming service.
2013-04-05T19:45:13  PID[2084] Error       ZOMG THIS IS BAD
I can also turn on Web Server Logging:

If you are using node.js, you'll need to turn on logging in the iisnode.yml. Make sure logging is turned on in your iisnode.yml:# For security reasons, logging, dev errors, and debugging # should be disabled in production deployments: loggingEnabled: false debuggingEnabled: false devErrorsEnabled: false node_env: production
And stream the raw IIS logs as well!
C:\>azure site log tail loggingtest -p http
info: Executing command site log tail
2013-04-05T20:03:59 Welcome, you are now connected to log-streaming service.
2013-04-05 20:04:15 LOGGINGTEST GET / X-ARR-LOG-ID=5a267b3f-6c0e-4a1d-9cb6-d872e
31a2f2e 80 - 166.147.88.43 Mozilla/5.0+(Windows+NT+6.2;+WOW64)+AppleWebKit/537.3
1+(KHTML,+like+Gecko)+Chrome/26.0.1410.43+Safari/537.31 ARRAffinity=edd1561bc28b
b0ea9133780b878994b30ed4697656295364ebc8aadc14f54d2;+WAWebSiteSID=57051e6cd07a4
I can also just download the logs directly to disk from the command line.
C:\>azure site log download loggingtest
info: Executing command site log download
+ Downloading diagnostic log
info: Writing to diagnostics.zip
info: site log download command OK
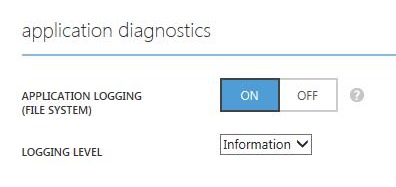
This feature is in Azure today, and in a few days the UI will appear in the management portal as well. It will look like this. The best part of this UI is that it will allow you to turn it on and off plus change the logging level without recycling the app domain.
Changing the web.config causes an app restart. Since you often want to change your log levels without a restart, these Azure-specific trace settings are stored in /site/diagnostics/settings.json within your instance. You can FTP in and see if you like.
Azure will use your existing trace settings from web.config unless these overriding settings exist.
Remember, you can view these streamed logs on the client using Windows Azure PowerShell (Windows) or Windows Azure Cross Platform Command Line Interface (Windows, Mac and Linux).
Things to be aware of
Turning logging on will turn it on only for 12 hours. You don't usually want logs on forever. Conveniently, if you connect a streaming client, then logging gets auto enabled.
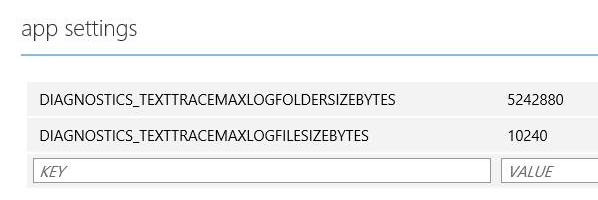
The defaults are to split log files at 128k and keep your app logs under 1MB and the whole logs folder under 30MB. If you need more, you can override some advanced settings directly in the portal.
Here I'm setting the log file splits to 10k and the max Application log to 5MB.
Here's some advanced settings you can override:
- DIAGNOSTICS_LASTRESORTFILE - "logging-errors.txt"
- The name (or relative path to the LogDirectory) of the file where internal errors are logged, for troubleshooting the listener.
- DIAGNOSTICS_LOGGINGSETTINGSFILE - "..\diagnostics\settings.json"
- The settings file, relative to the web app root.
- DIAGNOSTICS_TEXTTRACELOGDIRECTORY - "..\..\LogFiles\Application"
- The log folder, relative to the web app root.
- DIAGNOSTICS_TEXTTRACEMAXLOGFILESIZEBYTES - 128 * 1024 (bytes)
- Default: 128 kb log file
- DIAGNOSTICS_TEXTTRACEMAXLOGFOLDERSIZEBYTES - 1024 * 1024 (bytes)
- Default: 1 MB Application Folder (30 MB entire Logs Folder)
In the future, I expect we'll see easy ways to put logs in Azure table storage as well as command line querying by time, pid, etc. It would also be nice to be able to get to these logs from inside of Visual Studio.
Routing More Data to Tracing with Glimpse
If you haven't used Glimpse, you're in for a treat. I'll post again about Glimpse next week. Glimpse is a client side debugging framework for your web app.
I used NuGet to bring in "Glimpse.Mvc4" (Be sure to get the right one for you, like Glimpse.Mvc3, or Glimpse.EF5, etc. Check out http://getglimpse.com for more details).
Glimpse doesn't do anything until you turn it on. Locally I hit http://localhost:xxxx/Glimpse.axd and turn it on. Now, I visit the Trace tab and the Trace from earlier is there.
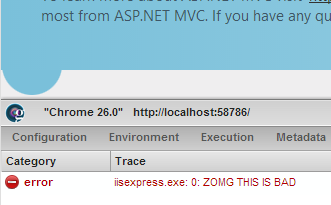
But if I go to the Timeline Tab, I get way more information, including all the ASP.NET events that are interesting to me. These "bracketing" events about befores and afters could be super useful if they were routed to System.Diagnostics.Trace.
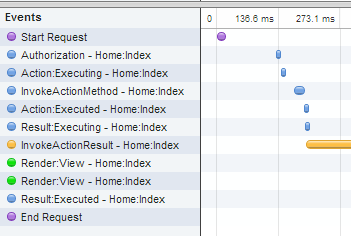
How do I get this timeline view information routed to Tracing? Easy. I'll watch the Glimpse Timeline and route!
using Glimpse.Core.Extensibility;
using Glimpse.Core.Message;
public class TimelineTracer : IInspector
{
public void Setup(IInspectorContext context) {
context.MessageBroker.Subscribe<ITimelineMessage>(TraceMessage);
}
private void TraceMessage(ITimelineMessage message) {
var output = string.Format(
"{0} - {1} ms from beginning of request. Took {2} ms to execute.",
message.EventName,
message.Offset.Milliseconds,
message.Duration.Milliseconds);
System.Diagnostics.Trace.TraceInformation(output, message.EventCategory.Name);
}
}
Now I get lots of great Glimpse-supplied timing info in my Trace log as well that I can stream from the command line.
C:\>azure site log tail loggingtest
info: Executing command site log tail
2013-04-05T20:22:51 Welcome, you are now connected to log-streaming service.
2013-04-05T20:23:32 PID[1992] Information Start Request - 0 ms from beginning of request. Took 0 ms to execute.
2013-04-05T20:23:32 PID[1992] Information Authorization - Home:Index - 224 ms from beginning of request. Took 0 ms to execute.
2013-04-05T20:23:32 PID[1992] Information Action:Executing - Home:Index - 239 ms from beginning of request. Took 0 ms to execute.
2013-04-05T20:23:32 PID[1992] Error ZOMG THIS IS BAD
2013-04-05T20:23:32 PID[1992] Information InvokeActionMethod - Home:Index - 289 ms from beginning of request. Took 29 ms to execute.
2013-04-05T20:23:32 PID[1992] Information Action:Executed - Home:Index - 320 ms from beginning of request. Took 0 ms to execute.
I'm pretty stoked that it's was so easy to get subsystems like ASP.NET, Glimpse and now Web Sites on Azure to work together and share information.
I'm not sure which way I'll finally end up using them, but I'm definitely planning on instrumenting my code and calling System.Diagnostics.Trace more often since I can so easily route the results.
Finally, it's worth mentioning in case you didn't know, that all the Azure SDK is open source and is calling web services on the backend that you can call yourself. If you dig this log streaming feature, did you know you could have watched it get checked in from a Pull Request 3 months ago? Madness. It's a kinder, gentler Death Star over here at Microsoft.
About Scott
Scott Hanselman is a former professor, former Chief Architect in finance, now speaker, consultant, father, diabetic, and Microsoft employee. He is a failed stand-up comic, a cornrower, and a book author.
About Newsletter
Can't wait to try this out.
I've been trying to explain to my stock advisor why I believe MS shares will rise. I think watching the tool developers progress is like watching the companies that make cardboard boxes. When they get busy, that's your cue for economic growth. Things have really changed and the world just doesn't know it yet.
Go, guys, go.
When I create a new site with --git, everything works like in the example.
My guess for the PowerShell equivalent command for this is
Get-AzureWebsiteLog -tail
The new look is interesting, but there seem to be a few nigglies. If I hover over the last link in the page "you could have watched it get checked in from a Pull Request 3 months ago", then an extra line appears in the prior code sample box, and it moves the text down a line, which then means the mouse rehovers over the link, and it goes into a weird spasmic cycle.
Happens on a few pages, but only appears to effect certain elements in certain positions.
Using IE 9.
"And can you at specific window-size or any si
ze?".
It is not a major problem per se, but a little annoying reading the comments.
I have tried this with a node.js application, and it doesn't seem to work. This is my code:
var http = require('http');
http.createServer(function(req, res){
console.error("Hello World");
res.end("Hello World");
}).listen(process.env.port);
Is there anything else I would need to do?
I think you meant them. Great article by the way.
# For security reasons, logging, dev errors, and debugging
# should be disabled in production deployments:
loggingEnabled: false
debuggingEnabled: false
devErrorsEnabled: false
node_env: production
But at my test website my trace logs are not appearing in the LogFiles/Application folder. But I can see them in the trace.axd page. Am I missing something?
How can we get the thread ID included in the application log? If there are lots of requests coming in, that really the only way to distinguish where they are coming from (without manually adding extra info to every message).
Thanks!
Mick
Up until SDK 2.0 I used http://cloudlogging.codeplex.com/
which used Diagnostics.Trace (writing to a table and a queue - and I have separate apps to read these logs in a later time).
Currently it seems the above methods only works with web-role which I don't use and seems fairly expensive (to activate could service) comparing to a shared site instance I am currently using..
Can I use this method on a shared site instance? or maybe some other compelling solution?
Thanks, Ben.
For the trace logs, is there a way to get these writing to table storage in azure when using Azure Web Sites (not web or worker roles)?
Comments are closed.

This a great feature, not just a great feature but a testament to the focus you guys have with Azure.
Seriously guys, keep up the good work, Azure is not only pleasing to use but impressive at the same time, credit where credit is due.