Benchmarking .NET code

A while back I did a post called Proper benchmarking to diagnose and solve a .NET serialization bottleneck. I also had Matt Warren on my podcast and we did an episode called Performance as a Feature.
Today Matt is working with Andrey Akinshin on an open source library called BenchmarkDotNet. It's becoming a very full-featured .NET benchmarking library being used by a number of great projects. It's even been used by Ben Adams of "Kestrel" benchmarking fame.
You basically attribute benchmarks similar to tests, for example:
[Benchmark]
public byte[] Sha256()
{
    return sha256.ComputeHash(data);
}

[Benchmark]
public byte[] Md5()
{
    return md5.ComputeHash(data);
}
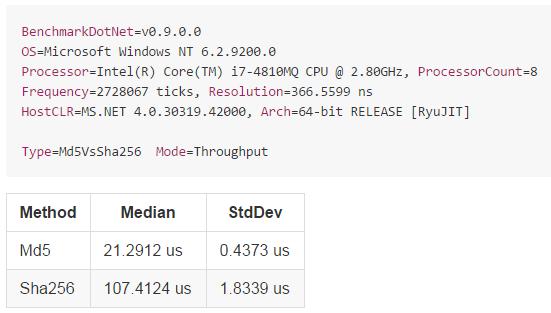
The result is lovely output like this in a table you can even paste into a GitHub issue if you like.

Basically it's doing the boring bits of benchmarking that you (and I) will likely do wrong anyway. There are a ton of samples for Frameworks and CLR internals that you can explore.
Finally it includes a ton of features that make writing benchmarks easier, including csv/markdown/text output, parametrized benchmarks and diagnostics. Plus it can now tell you how much memory each benchmark allocates, see Matt's recent blog post for more info on this (implemented using ETW events, like PerfView).
There's some amazing benchmarking going on in the community. ASP.NET Core recently hit 1.15 MILLION requests per second.
https://t.co/6ndwe0WEqa Core - 2300% More Requests Served Per Second #aspnetcore #dotnet #WebDev https://t.co/mOufivMyuO
— Ben Adams (@ben_a_adams) February 18, 2016
That's pushing over 12.6 Gbps a second. Folks are seeing nice performance improvements with ASP.NET Core (formerly ASP.NET RC1) even just with upgrades.
Upgraded stevedesmond.ca to @aspnet 5 RC (from b8), response time went from 20ms to 4ms. Not a typo. @DamianEdwards @shanselman @jongalloway
— Steve Desmond (@stevedesmond_ca) November 22, 2015
It's going to be a great year! Be sure to explore the ASP.NET Benchmarks on GitHub https://github.com/aspnet/benchmarks as we move our way up the TechEmpower Benchmarks!
What are YOU using to benchmark your code?
Sponsor: Thanks to my friends at Redgate for sponsoring the blog this week! Have you got SQL fingers?Try SQL Prompt and you’ll be able to write, refactor, and reformat SQL effortlessly in SSMS and Visual Studio. Find out more with a free trial!
About Scott
Scott Hanselman is a former professor, former Chief Architect in finance, now speaker, consultant, father, diabetic, and Microsoft employee. He is a failed stand-up comic, a cornrower, and a book author.
About Newsletter
Just to point out a spelling mistake. It should be "called BenchmarkDotNet" and not "celled BenchmarkDotNet". And link to the github repository should be nice here too.
https://github.com/Orcomp/NUnitBenchmarker
I hope benchamrking will become as ubiquitous as unit testing.
What I would really like to see is an open source initiative to properly define interfaces with accompanying unit tests and performance tests making it easier for people to compare their implementations on a level playing field.
Json serialization comes to mind, as well as various tree implementations.
Being able to compare the time complexity of different algorithms or data structures is also important. Some data structures can perform very well for small collection, but quickly deteriorate when the collection size grows. Also understanding how various data structures affect the GC as collection sizes grow, is also important.
Introducing NBench - an Automated Performance Testing Framework for .NET Applications
https://petabridge.com/blog/introduction-to-nbench/
The motivation behind it's birth was interesting. They've integrated the tool in to the build pipeline to ensure pull requests and patches don't negatively affect performance.
But that project is morphing a bit and will probably be added to a suite that I'm making. Plus I need to find time to optimize the graph generation for memory usage, etc.
https://github.com/stevedesmond-ca/LoadTestToolbox
It puts out "nice-ish" charts too
With regards to # and amount of memory allocations, BenchmarkDotNet already has that see http://mattwarren.github.io/2016/02/17/adventures-in-benchmarking-memory-allocations/
BenchmarkDotNet has a "SingleRun" mode that should give you what you need. See this sample for how it can be used
SERBENCH here are some charts:
Typical Person Serialization. What is interesting is that the most benchmarks provided by software makers are very skewed, i.e. serializers depend greatly on payload type, as our test indicated. Some things taken for granted like "Protobuff" is the fastest are not true in some test cases you see unexpected results. That's is why it is important to execute the same suite of test cases against different vendors. Sometimes benchmarking something is more work than writing the component, for example SpinLock class has many surprises.
Another thing that 90% of people I talk to disregard: SpeedStep. Try to disable it via control panel and dont be surprised that you get 25% perf boost EVEN IF you ran your tests for minutes. SpeedStep does magic tricks, it lowers you CPU clock even if the CPU is swamped, but not on all cores. Running tests from within VS(with debugger attached) can slow things down by good 45-70%. So I would say:
a. Test different work patterns
b. Build with Optimize
c. Run standalone (CTRL+f5)
d. Disable "Power Saver"/SpeedStep
e. Run for a reasonable time (not 2 seconds)
f. For multi-threaded perf dont forget to set GS SERVER MODE, otherwise your "new" will be 10-40% slower than it could
g. Profilers sometimes lie! They don't guarantee nothing. Great tools but sometimes they don't show whats happening and may be source of Heisenbugs
Comments are closed.
