Proper benchmarking to diagnose and solve a .NET serialization bottleneck
 Here's a few comments and disclaimers to start with. First, benchmarks are challenging. They are challenging to measure, but the real issue is that often we forget WHY we are benchmarking something. We'll take a complex multi-machine financial system and suddenly we're hyper-focused on a bunch of serialization code that we're convinced is THE problem. "If I can fix this serialization by writing a 10,000 iteration for loop and getting it down to x milliseconds, it'll be SMOOOOOOTH sailing."
Second, this isn't a benchmarking blog post. Don't point this blog post and say "see! Library X is better than library Y! And .NET is better than Java!" Instead, consider this a cautionary tale, and a series of general guidelines. I'm just using this anecdote to illustrate these points.
- Are you 100% sure what you're measuring?
- Have you run a profiler like the Visual Studio profiler, ANTS, or dotTrace?
- Are you considering warm-up time? Throwing out outliers? Are your results statistically significant?
- Are the libraries you're using optimized for your use case? Are you sure what your use case is?
A bad benchmark
A reader sent me a email recently with concern of serialization in .NET. They had read some very old blog posts from 2009 about perf that included charts and graphs and did some tests of their own. They were seeing serialization times (of tens of thousands of items) over 700ms and sizes nearly 2 megs. The tests included serialization of their typical data structures in both C# and Java across a number of different serialization libraries and techniques. Techniques included their company's custom serialization, .NET binary DataContract serialization, as well as JSON.NET. One serialization format was small (1.8Ms for a large structure) and one was fast (94ms) but there was no clear winner. This reader was at their wit's end and had decided, more or less, that .NET must not be up for the task.
To me, this benchmark didn't smell right. It wasn't clear what was being measured. It wasn't clear if it was being accurately measured, but more specifically, the overarching conclusion of ".NET is slow" wasn't reasonable given the data.
Hm. So .NET can't serialize a few tens of thousands of data items quickly? I know it can.
Related Links: Create benchmarks and results that have value and Responsible benchmarking by @Kellabyte
I am no expert, but I poked around at this code.
First: Are we measuring correctly?
The tests were using DateTime.UtcNow which isn't advisable.
startTime = DateTime.UtcNow;
resultData = TestSerialization(foo);
endTime = DateTime.UtcNow;
Do not use DateTime.Now or DateTime.Utc for measuring things where any kind of precision matters. DateTime doesn't have enough precision and is said to be accurate only to 30ms.
DateTime represents a date and a time. It's not a high-precision timer or Stopwatch.
In short, "what time is it?" and "how long did that take?" are completely different questions; don't use a tool designed to answer one question to answer the other.
And as Raymond Chen says:
"Precision is not the same as accuracy. Accuracy is how close you are to the correct answer; precision is how much resolution you have for that answer."
So, we will use a Stopwatch when you need a stopwatch. In fact, before I switch the sample to Stopwatch I was getting numbers in milliseconds like 90,106,103,165,94, and after Stopwatch the results were 99,94,95,95,94. There's much less jitter.
Stopwatch sw = new Stopwatch();
sw.Start();

// stuff

sw.Stop();
You might also want to pin your process to a single CPU core if you're trying to get an accurate throughput measurement. While it shouldn't matter and Stopwatch is using the Win32 QueryPerformanceCounter internally (the source for the .NET Stopwatch Class is here) there were some issues on old systems when you'd start on one proc and stop on another.
// One Core
var p = Process.GetCurrentProcess();
p.ProcessorAffinity = (IntPtr)1;
If you don't use Stopwatch, look for a simple and well-thought-of benchmarking library.
Second: Doing the math
In the code sample I was given, about 10 lines of code were the thing being measured, and 735 lines were the "harness" to collect and display the data from the benchmark. Perhaps you've seen things like this before? It's fair to say that the benchmark can get lost in the harness.
Have a listen to my recent podcast with Matt Warren on "Performance as a Feature" and consider Matt's performance blog and be sure to pick up Ben Watson's recent Book called "Writing High Performance .NET Code".
Also note that Matt is currently exploring creating a mini-benchmark harness on GitHub. Matt's system is rather promising and would have a [Benchmark] attribute within a test.
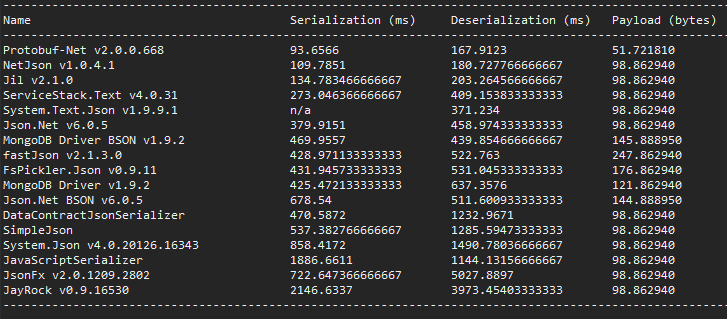
Considering using an existing harness for small benchmarks. One is SimpleSpeedTester from Yan Cui. It makes nice tables and does a lot of the tedious work for you. Here's a screenshot I stole borrowed from Yan's blog.
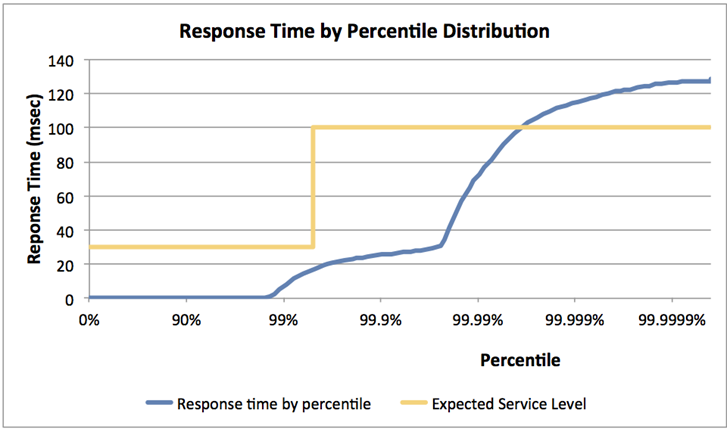
Something a bit more advanced to explore is HdrHistogram, a library "designed for recoding histograms of value measurements in latency and performance sensitive applications." It's also on GitHub and includes Java, C, and C# implementations.
And seriously. Use a profiler.
Third: Have you run a profiler?
Use the Visual Studio Profiler, or get a trial of the Redgate ANTS Performance Profiler or the JetBrains dotTrace profiler.
Where is our application spending its time? Surprise I think we've all seen people write complex benchmarks and poke at a black box rather than simply running a profiler.

Aside: Are there newer/better/understood ways to solve this?
This is my opinion, but I think it's a decent one and there's numbers to back it up. Some of the .NET serialization code is pretty old, written in 2003 or 2005 and may not be taking advantage of new techniques or knowledge. Plus, it's rather flexible "make it work for everyone" code, as opposed to very narrowly purposed code.
People have different serialization needs. You can't serialize something as XML and expect it to be small and tight. You likely can't serialize a structure as JSON and expect it to be as fast as a packed binary serializer.
Measure your code, consider your requirements, and step back and consider all options.
Fourth: Newer .NET Serializers to Consider
Now that I have a sense of what's happening and how to measure the timing, it was clear these serializers didn't meet this reader's goals. Some of are old, as I mentioned, so what other newer more sophisticated options exist?
There's two really nice specialized serializers to watch. They are Jil from Kevin Montrose, and protobuf-net from Marc Gravell. Both are extraordinary libraries, and protobuf-net's breadth of target framework scope and build system are a joy to behold. There are also other impressive serializers in including support for not only JSON, but also JSV and CSV in ServiceStack.NET.
Protobuf-net - protocol buffers for .NET
Protocol buffers are a data structure format from Google, and protobuf-net is a high performance .NET implementation of protocol buffers. Think if it like XML but smaller and faster. It also can serialize cross language. From their site:
Protocol buffers have many advantages over XML for serializing structured data. Protocol buffers:
- are simpler
- are 3 to 10 times smaller
- are 20 to 100 times faster
- are less ambiguous
- generate data access classes that are easier to use programmatically
It was easy to add. There's lots of options and ways to decorate your data structures but in essence:
var r = ProtoBuf.Serializer.Deserialize<List<DataItem>>(memInStream);
The numbers I got with protobuf-net were exceptional and in this case packed the data tightly and quickly, taking just 49ms.
JIL - Json Serializer for .NET using Sigil
Jil s a Json serializer that is less flexible than Json.net and makes those small sacrifices in the name of raw speed. From their site:
Flexibility and "nice to have" features are explicitly discounted in the pursuit of speed.
It's also worth pointing out that some serializers work over the whole string in memory, while others like Json.NET and DataContractSerializer work over a stream. That means you'll want to consider the size of what you're serializing when choosing a library.
Jil is impressive in a number of ways but particularly in that it dynamically emits a custom serializer (much like the XmlSerializers of old)
Jil is trivial to use. It just worked. I plugged it in to this sample and it took my basic serialization times to 84ms.
result = Jil.JSON.Deserialize<Foo>(jsonData);
Conclusion: There's the thing about benchmarks. It depends.
What are you measuring? Why are you measuring it? Does the technique you're using handle your use case? Are you serializing one large object or thousands of small ones?
James Newton-King made this excellent point to me:
"[There's a] meta-problem around benchmarking. Micro-optimization and caring about performance when it doesn't matter is something devs are guilty of. Documentation, developer productivity, and flexibility are more important than a 100th of a millisecond."
In fact, James pointed out this old (but recently fixed) ASP.NET bug on Twitter. It's a performance bug that is significant, but was totally overshadowed by the time spent on the network.
This bug backs up the idea that many developers care about performance where it doesn't matter https://t.co/LH4WR1nit9
— James Newton-King (@JamesNK) February 13, 2015
Thanks to Marc Gravell and James Newton-King for their time helping with this post.
What are your benchmarking tips and tricks? Sound off in the comments!
About Scott
Scott Hanselman is a former professor, former Chief Architect in finance, now speaker, consultant, father, diabetic, and Microsoft employee. He is a failed stand-up comic, a cornrower, and a book author.
About Newsletter
Benchmarks shown on the following pages shows ~16-25 times faster serialization compared to protobuf on .NET. One design point of SBE is that it does not allocate memory!
"A typical market data message can be encoded, or decoded, in ~25ns compared to ~1000ns for the same message with GPB on the same hardware. XML and FIX tag value messages are orders of magnitude slower again." -- Martin Thompson
http://weareadaptive.com/blog/2013/12/10/sbe-1/
http://mechanical-sympathy.blogspot.ca/2014/05/simple-binary-encoding.html
https://github.com/real-logic/simple-binary-encoding
Just for completeness, it's worth noting that Jil also has a TextReader & TextWriter overloads for stream serialization/deserialization as well.
We're a bit fanatical about allocations over here at Stack - unless there's a good reason to allocate the entire string (e.g. debugging) we generally avoid it and prefer streams at all times.
This an area that has caused us a lot of pain over the years so we developed a solution we hope can provide some ideas for someone to make something even better.
The main goal for us is to treat performance tests as important as unit tests when writing code, and they should also be as easy to write as unit tests.
These are some points that are important to us:
- The time complexity of a piece of code needs to be measured over different data sizes.
- Write performance tests against an interface so that the same performance tests can be re-used against multiple implementations.
- Benchmark multiple implementations altogether and display the results in real time.
- Collaborate on some standard performance fixtures that will be widely accepted and used by the community. (Which I hope will also lead to better interface designs and acceptance.)
- Take into account Garbage collection.
With these points in mind we started working on Nperf (https://github.com/Orcomp/NPerf) and NPerfFixtures (https://github.com/Orcomp/NPerf.Fixtures).
We even created a ISerializer fixture, and compared some serialization implementations. (https://github.com/Orcomp/NPerf.Fixtures/blob/master/docs/ISerializer/ISerializerDocs.md)
We then moved to NUnitBenchmarker because we really wanted performance tests to be as easy to write as unit tests, so we basically leveraged all the features that come with NUnit.
(i.e. if you can write Nunit tests, you can write performance tests.)
These are the links
Github: https://github.com/Orcomp/NUnitBenchmarker
Nuget: https://www.nuget.org/packages/NUnitBenchmarker.Benchmark/1.1.0-unstable0005
NUnitBenchmarker is already useful but there is still a lot more to do. (It uses SimpleSpeedTester internally.)
PerfUtil (https://github.com/nessos/PerfUtil) has also caught our attention because it will also report on GC gen0, GC gen1 and GC gen2 times.
I hope Scott's post will create some constructive discussions that can focus the community in coming up with a good solution.
Just one thing, I didn't write the .net performance book, the author is Ben Watson. I just recommended it because it's brilliant!
As a perfectionist (and most great programmers are), I have a tendency like the above mentioned process to nitpick every single little thing while I'm profiling and benchmarking. And I have found that far too often my code isn't being used by enough people, or is fast enough already that benchmarking is actually a great waste of mine and others time.
I only ever break out the benchmarking when I've actually come to the conclusion that the item that has been written is actually too slow and needs to be made faster.
Far too often I write stuff that elements outside of the users control (latency, HDD speeds, etc) are actually the limiting factors of performance, and I have found that waiting until later allows me to be more productive.
On the other hand in performance critical areas, the above advice is totally crummy and you need to benchmark the heck out of it. There are a few areas in my latest project that we found out our performance targets were actually the reverse of the typical target. Our software was heavily predicated to improving second run performance (as are many), but due to the amount of development and testing going on those areas were actually costing major development time as we were pre-rendering activities that weren't being used in that particular developers tests. Anyways we found that we needed to have conditional compile options to be able to actually disable some of the performance optimizations in order to optimize the least likely option (first run).
- Benchmark in Release mode and no debugger attached.
- Unless you care about startup time, warm up the code you want to benchmark before you start the timer. Loading types, JITing, instantiating static variables, and so on takes time.
- If you're using a profiler like dotTrace, be aware that turning on features like line by line performance analysis will distort the results. High level sampling is better to figure out where time is being spent.
~ James
It is important to measure perf and do regression testing but you will always need be able to do production profiling.
For such hard to find bugs nothing beats xperf since you can record system wide everything. If you do not want 100 GB of files you can record into a ring buffer and stop profiling when something did happen. That way you can record the interesting stuff without having too much data.
You can even do something like debugging with a profiler (profbugging?).
E.g. if you find LOH (Large Object Heap) allocations of object[] which comes from Delegate.Remove I know that I have at least one event handler which has more than 10625 subscribers. Why? Because the object array was allocated on the LOH heap and must be bigger than 85000 bytes. On x64 the reference size is 8 where I can store in the delegate invocation list at least 85000/8=10625 references.
This tells me that apart from many allocations we also have leaked event handler possible due to previous errors.
For the fastest serializer on the planet you need to be GC allocation free where already solutions exist as Phil Bolduc has pointed out. Unfortunately the .NET serializer do not support allocation free programing at all. Some caching and buffer reuse would be cool. More APIs should accept ArraySegment<byte> instead of plain byte[] arrays and a way to get notified when the buffer is no longer used by the serializer to pool it again.
https://github.com/cmbrown1598/Benchy
It allows you to setup tests and mark tests as failing if your test fails to meet a particular benchmark, and it comes with a basic runner.
Give it a looksee!
Christopher
http://blogs.msdn.com/b/oldnewthing/archive/2014/08/22/10551965.aspx
https://msdn.microsoft.com/en-us/library/windows/desktop/dn553408%28v=vs.85%29.aspx
Jil and ProtoBuf seem to go head to head, but then Netserializer comes along.... Wowza.
Once you know to look for Coordinated Omission, you see it EVERYWHERE.
http://www.nuget.org/packages/Microsoft.Hadoop.Avro/
I will be using this as a rule of thumb and thank you for the links to so many useful tools!
Comments are closed.


